Customers
High sales can hide weak margin, costly delivery patterns, long credit, and unprofitable SKU combinations.
FMCG distribution profit analysis
We show you exactly where—from customers and SKUs to pricing, suppliers, inventory, sales teams, and working capital—and turn the evidence into a prioritized 90-day profit action plan.
The management problem
The same customer, product, or supplier can look attractive in a sales report and weak after discounts, returns, cost movements, service effort, inventory, or credit are considered.
High sales can hide weak margin, costly delivery patterns, long credit, and unprofitable SKU combinations.
Volume can grow while price realization falls, purchase cost rises, or returns erase the expected margin.
Discount exceptions, price dispersion, rebates, and credit notes can quietly reduce realized gross profit.
Cost movements, rebates, claims, payment terms, and slow stock determine the true value of a supplier relationship.
Ageing, excess stock, expiry exposure, and weak replenishment tie up cash before they appear as a write-off.
Revenue alone does not show the quality of mix, discount discipline, returns, collections, or cost-to-serve.
Illustrative management case
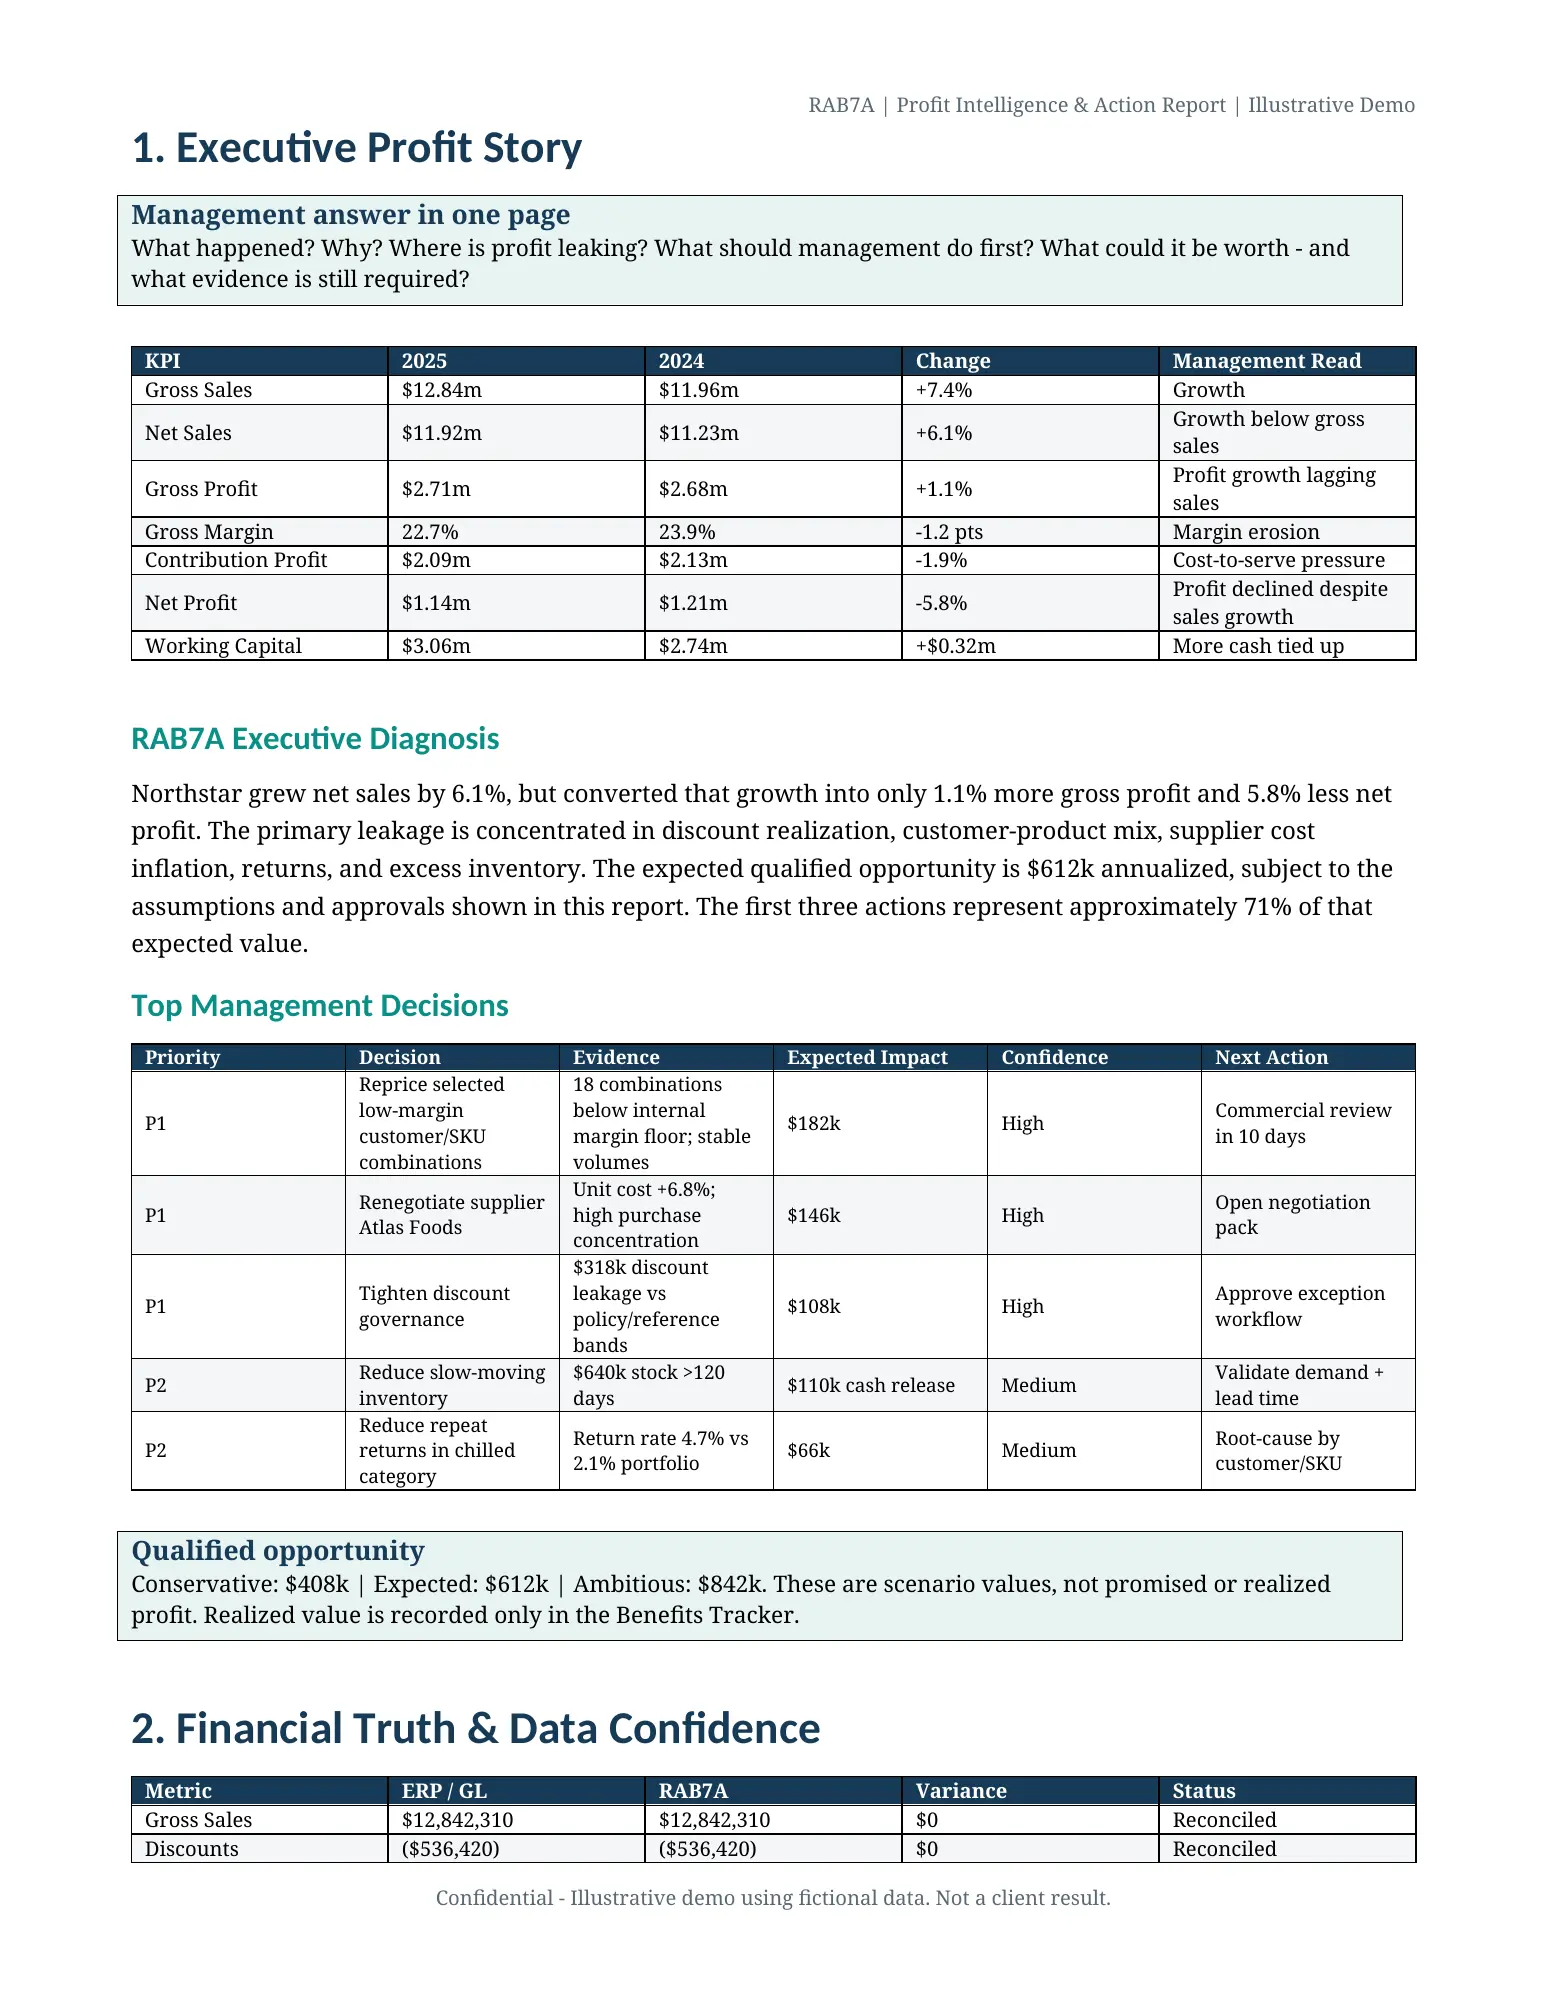
In this fictional distributor example, net sales increased while gross margin, net profit, and working capital moved in the wrong direction. The report connects the change to specific decisions instead of stopping at the variance.
Illustrative fictional data—not a client result or guaranteed outcome.Inside the deliverable
Every recommendation connects the evidence, root cause, financial impact, confidence, risk, owner, and next action. Expected value is never presented as realized profit.
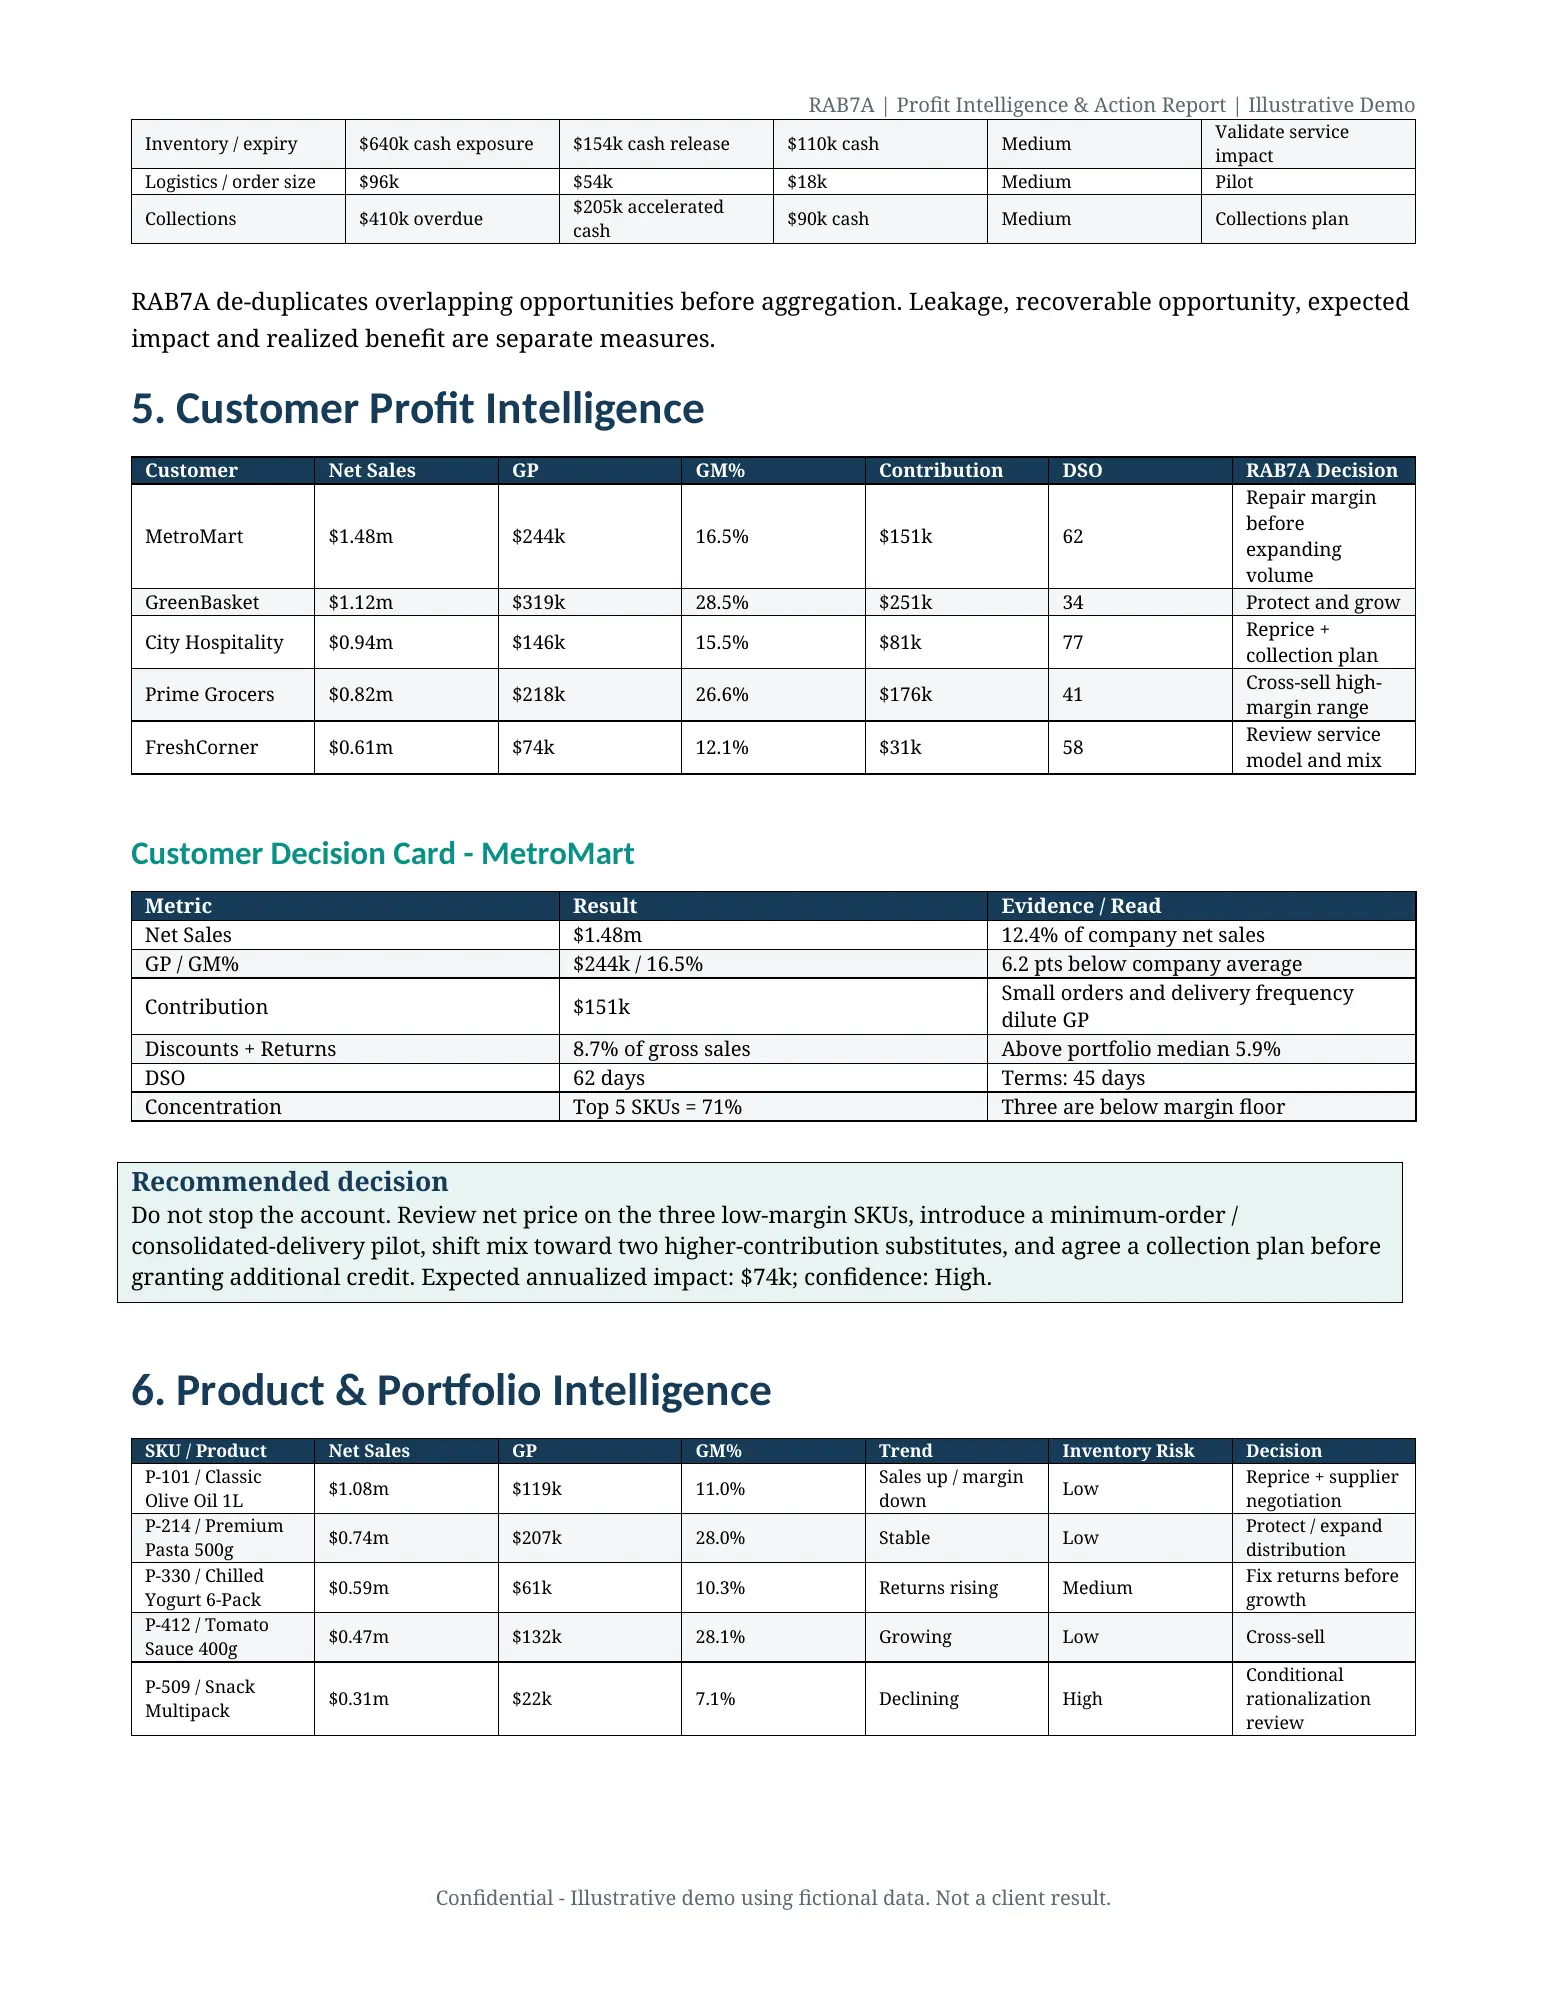
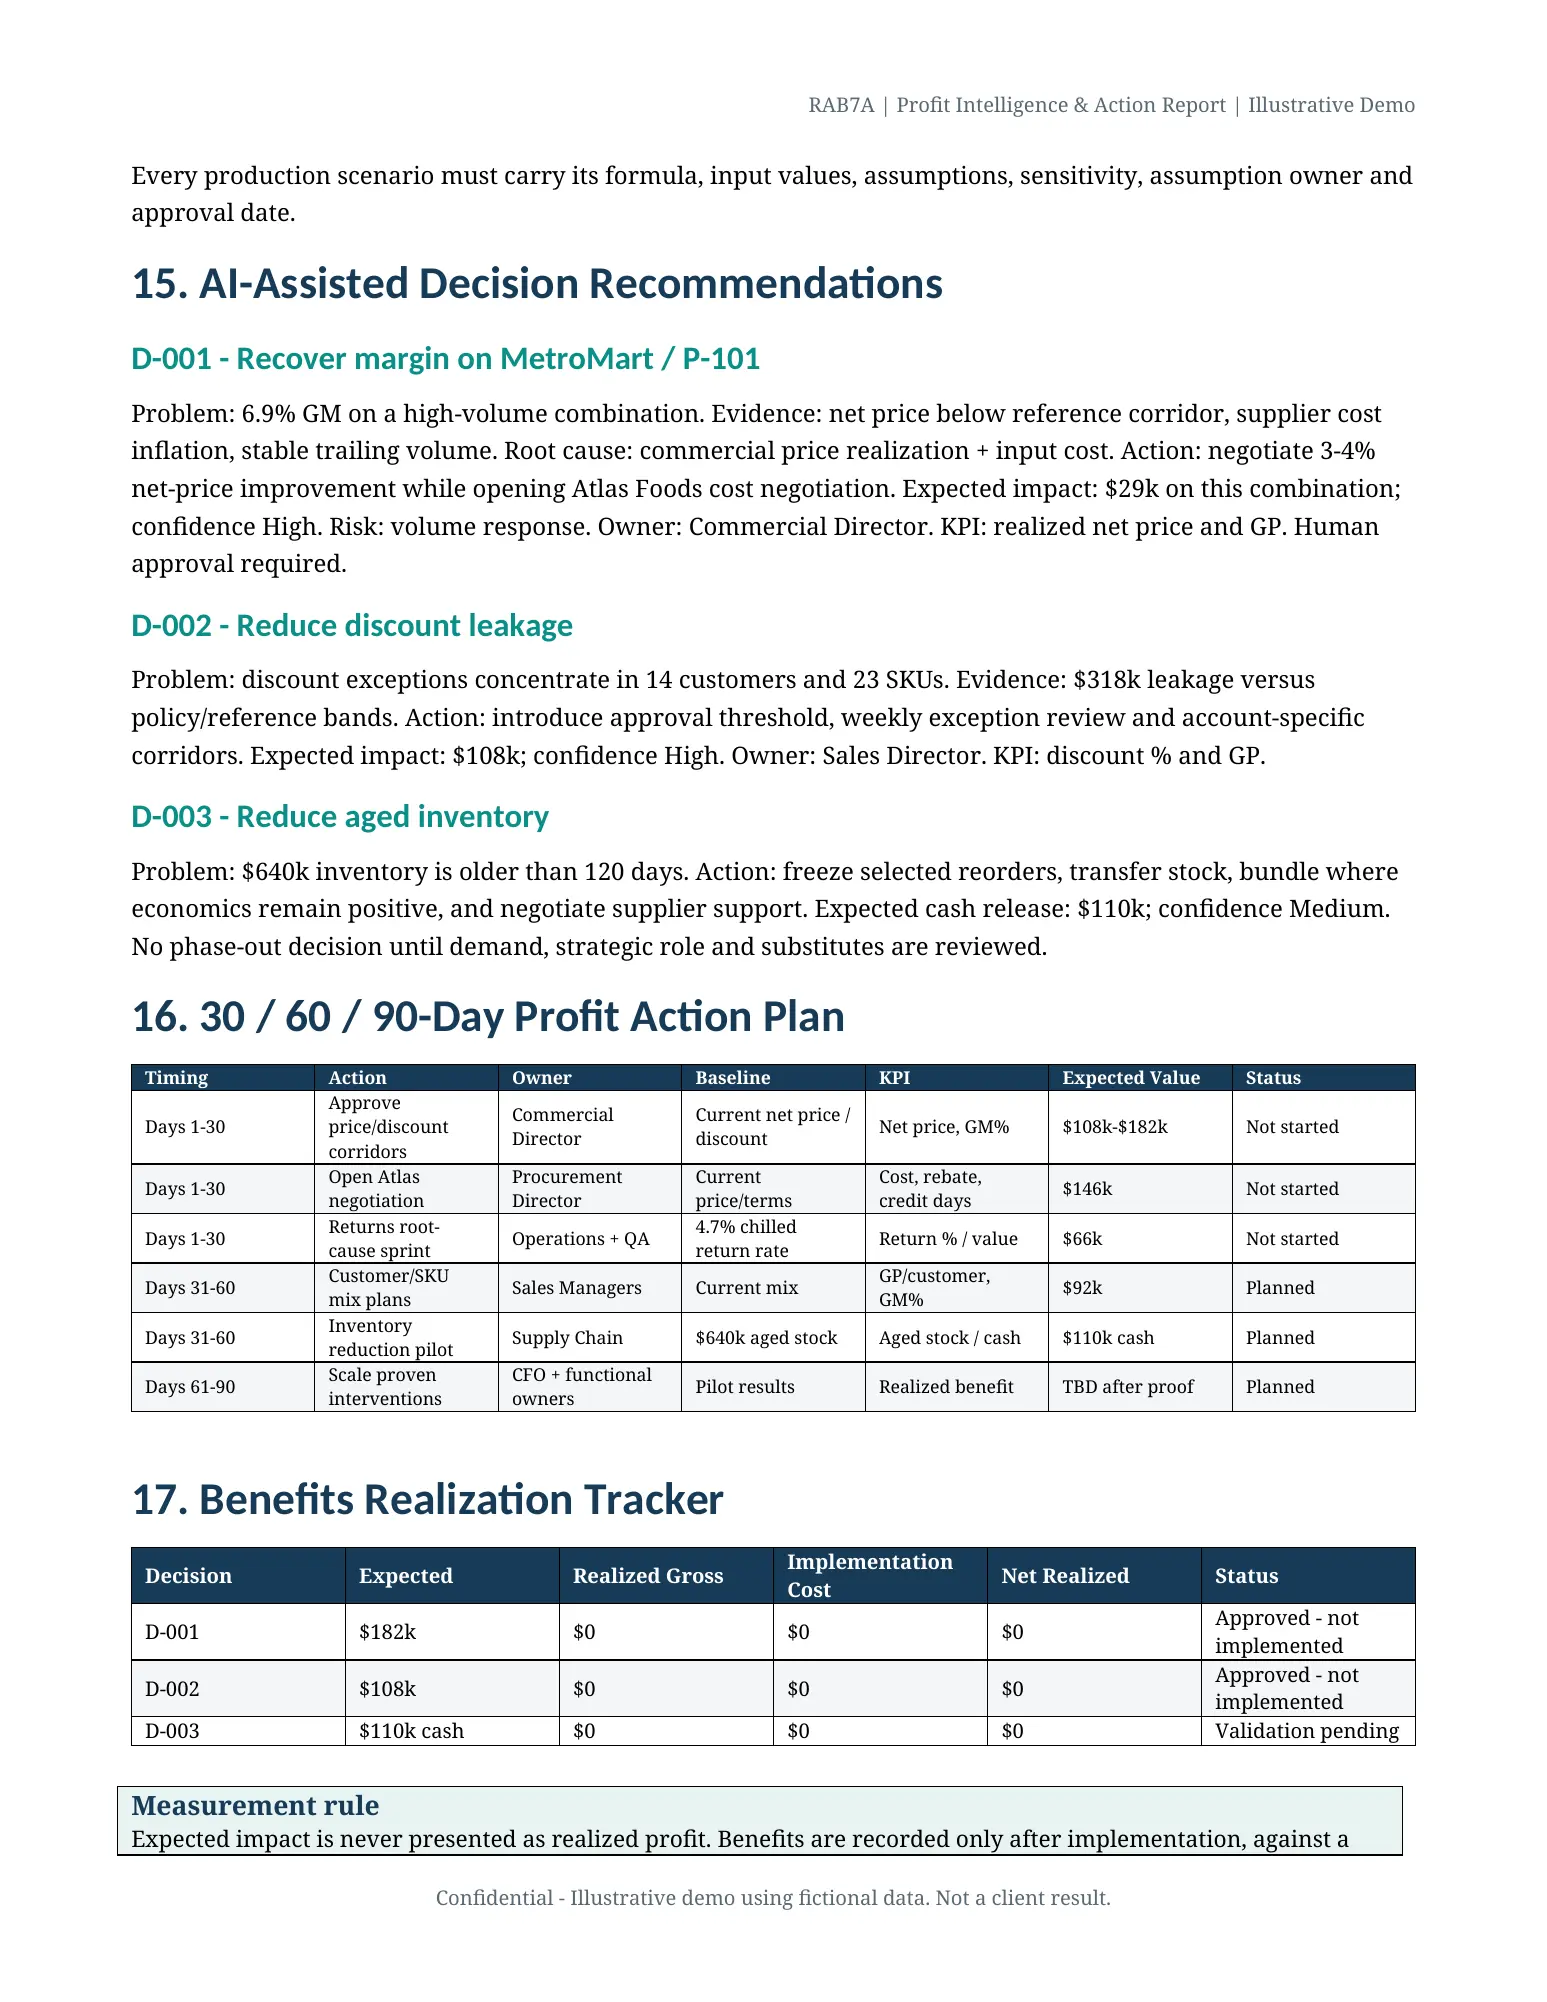
All names and values in the sample are fictional.
What you receive
Final scope depends on the files available. Missing evidence is shown as a limitation rather than replaced with a generic benchmark.
What changed, why it changed, and what management should examine first.
Explore →Quantified leakage, qualified opportunity, evidence, confidence, and validation required.
Explore →Grow, protect, repair, reprice, renegotiate, reduce, or review—with the reason for each action.
Explore →Ageing, expiry, excess stock, receivables, and cash-release actions kept separate from profit impact.
Explore →Conservative, expected, and ambitious cases using visible, client-approved assumptions.
Explore →Priorities, owners, deadlines, KPIs, baselines, and a benefits-realization tracker.
Explore →Built from inside FMCG distribution
The engagement is led by Issam Shehadeh, a general manager with more than 15 years inside FMCG distribution—covering procurement, pricing, P&L, supplier negotiations, inventory, key accounts, HORECA, retail, credit, and commercial execution.
This matters because a low-margin line is not automatically a product to stop, and a high-sales customer is not automatically a customer to grow. Recommendations must reflect contracts, assortment role, supplier economics, delivery reality, collections, and management constraints.
Insights & articles
Understand the calculations, evidence and decision logic behind customer, product, margin, leakage and inventory analysis.
Find high-sales accounts with weak profit contribution.
Read the guide →Connect price, cost, returns, inventory and customer mix.
Read the guide →Trace recurring leakage to evidence and accountable action.
Read the guide →Separate price, cost, mix, discounts and returns.
Read the guide →Keep cash release, stock risk and profit impact distinct.
Read the guide →Diagnose why higher FMCG revenue can produce lower profit.
Read the guide →Know when gross margin is enough—and when cost-to-serve matters.
Read the guide →Free 90-day profit leakage diagnostic
We connect customers, products, pricing, discounts, returns, and cost—not just totals on a dashboard.
Clear pricing after the diagnostic
One company · one data source · monthly core profit analysis
Inventory, expenses, suppliers, deeper analysis and monthly management review
Multiple entities, branches or systems · custom integration and support
A complete standalone profit analysis without a monthly subscription
The selected currency is used on your quote and payment link. Final scope and fee are confirmed in writing before payment. Taxes, bank conversion charges, and gateway availability may vary by country.
How it works
Upload a few exports securely and tell us the decision management needs to make.
We identify supported modules, missing evidence, confidentiality needs, timing, and fee.
We reconcile the numbers, diagnose drivers, model scenarios, and review assumptions.
Management receives the report, priority actions, owners, KPIs, and benefits tracker.
Confidential first step
Send the latest 90 days of sample exports. Complete data receives a profit leakage diagnostic; incomplete data receives verified findings only, with limitations stated clearly.
Begin with sample exports. A formal NDA can be completed before full data is shared.
Files are uploaded through the website and linked to a unique submission reference.
We distinguish measured facts, modelled scenarios, assumptions, and unknowns.
Paid work starts only after the written scope, fee, timeline, and deliverables are accepted.